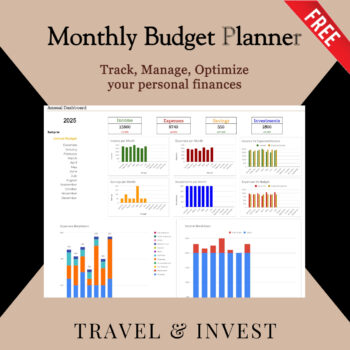
Download this FREE Monthly Budget tool for Google Sheets! Track income, expenses, savings, and investments with annual and monthly dashboards featuring clear breakdown charts. Easily customize categories and log each expense—perfect for anyone who wants a simple yet powerful way to master their finances.
Unlock the power to take control of your finances with this FREE Monthly Budget Google Sheets tool! Built for clarity and customisation, this spreadsheet helps track your income, expenses, savings, and investments throughout the year.
Annual Budget Sheet (Dashboard)
Get a comprehensive, year-long overview with intuitive graphs:
•Income per Month: Bar chart showing total income earned each month, so you can identify trends or fluctuations across the year.
•Expenses per Month: Visualizes monthly total expenses, helping you spot high-spend periods and manage cash flow.
•Income vs Expected Income: Compares actual monthly income to your expected goals, highlighting months you meet or miss targets.
•Expenses vs Budget: Compares your monthly expenses to expected/budgeted expenses, allowing for quick assessment of overspending or savings.
•Savings per Month: Tracks how much is saved each month, motivating consistent saving habits.
•Investments per Month: Visual representation of your monthly investments, ideal for tracking wealth-building efforts.
•Expenses Breakdown: Stacked bar chart displaying detailed expense categories by month, clearly showing how individual cost areas contribute to your overall spending.
•Income Breakdown: Stacked bar chart of income sources (like Salary and Side Hustle) per month, offering insights into income diversification.
Monthly Tabs (January–December)
Drill down into each month with powerful, actionable visuals:
•Income vs Expected Income: A horizontal bar chart comparing actual and expected monthly income, instantly showing if income targets are met.
•Actual vs Expected (Expenses/Savings/Investments): Compares your actual total outflows (expenses, savings, investments) to expected, helping to maintain budget discipline.
•Monthly Income Allocation: Pie chart showing how income is split among expenses, savings, and investments, giving a clear overview of spending vs. wealth growth.
•Source of Money: Pie chart breaking down which sources (like salary or side hustle) contributed to your monthly income.
•Cash Flow: A clear bar graph displaying total income vs. total expenses for the month, making it easy to see if you’re living within your means.
•Expenses Breakdown: Detailed bar chart of spending by category—perfect for finding patterns and areas for cost-cutting.
Categories Sheet
Customize your experience! Enable or disable categories for Income, Expenses, Savings, and Investments according to what’s relevant for your situation. Personalize everything to keep your budget simple and highly effective.
Expenses Sheet
Log every expense with the Expenses Log. Record the day, month, description, category, and amount spent. This makes tracking, reviewing, and optimizing expenses straightforward.
This tool is ideal for anyone who wants to master personal finance and start building long-term wealth. Download, customize, and start your financial journey today—absolutely free!