Portfolio & Dividend Tracker
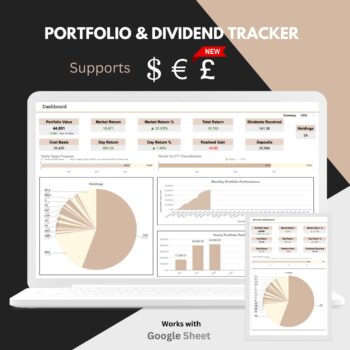
A Google Sheets tracker for stocks and ETFs. Live prices, dividends by month and by ticker, realised and unrealised return, and your best and worst performers — in USD, EUR or GBP.
[v10.1 · Released August 26] Supports USD, EUR & GBP
The Portfolio & Dividend Tracker is a Google Sheets file you copy to your own Drive and fill with your holdings. It pulls prices in, works out what you have made and what you have been paid, and puts both on one dashboard.
It is built for people holding a mix of stocks and ETFs across more than one broker, who want the numbers in one place instead of in four broker apps.
What the dashboard shows
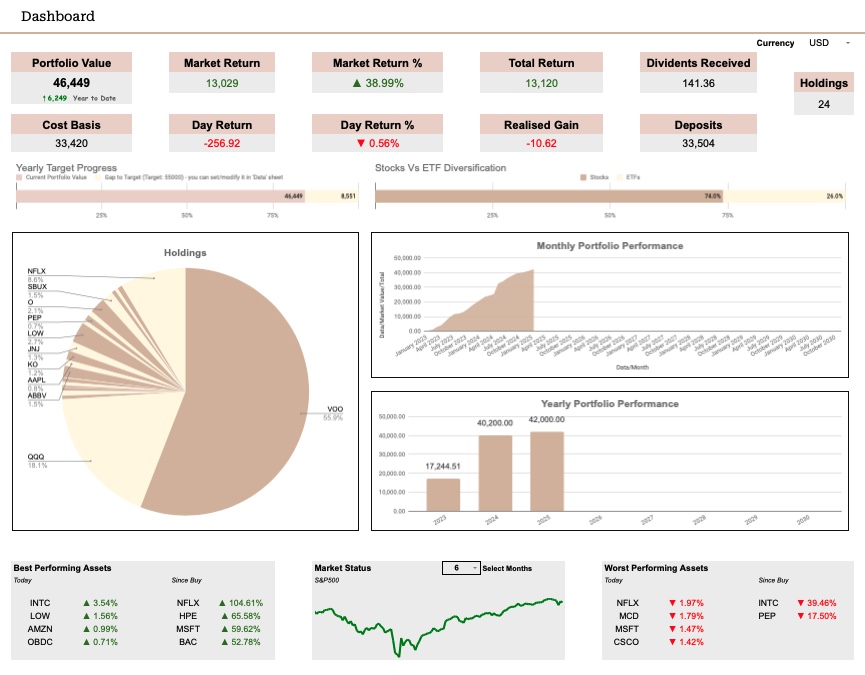
Eleven figures across the top, updated as prices move:
Portfolio value, with the change year to date
Cost basis and total deposits
Market return, in cash and as a percentage
Total return, including dividends
Day return, in cash and as a percentage
Realised gain on positions you have closed
Dividends received, and the number of holdings
Below that: progress against a yearly target you set yourself, your stocks-versus-ETFs split, a pie of holdings by ticker, and monthly and yearly performance.
Dividends, and what each holding actually did
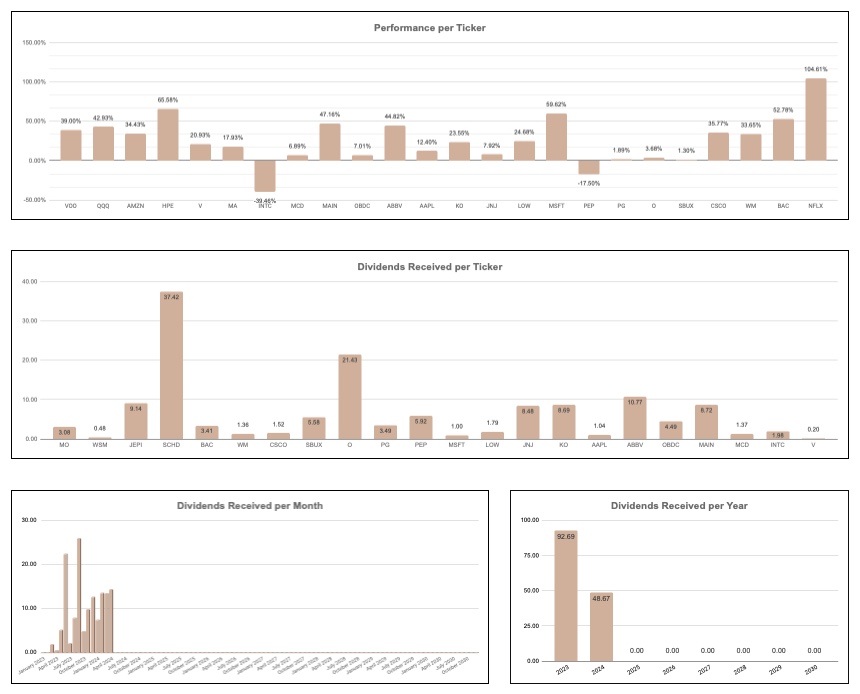
Dividends are broken out three ways — by ticker, by month and by year — next to a per-ticker performance bar. It is the quickest way to see which holdings are paying you and which are only promising to.
Concentration you can see
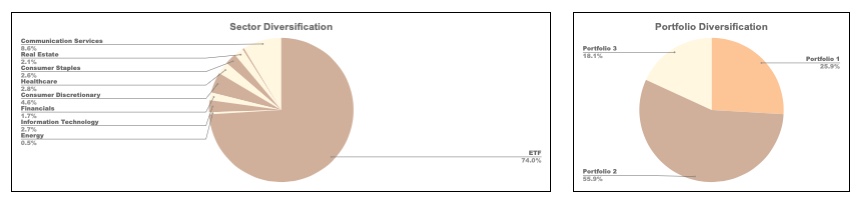
Two pies: one by sector, one by holding. Concentration is easy to miss when you add positions one at a time, and obvious the moment it is drawn.
What else is in it
Prices that work outside the US — US tickers price from Google Finance, and European listings price too, including UCITS lines on the London, Amsterdam and German exchanges. Getting European tickers to return a price at all is the thing most spreadsheet trackers cannot do.
Dividend calendar — what landed and when, so you can see which months are thin before they arrive.
Best and worst performers — today and since you bought, side by side. The second column is the one that matters, and most trackers leave it out.
Market status — the S&P 500 over a period you choose, so your own numbers have something to sit against.
Multiple portfolios in one file — separate strategies, or one per broker, without a second copy of the sheet.
Mobile dashboard — a layout meant for a phone, not a desktop sheet pinched down.
Three currencies — USD, EUR and GBP, which matters if you hold across more than one exchange.
What you need
A free Google account. No Excel licence, no subscription and no monthly fee — you buy it once and the file is yours.
What you get after purchase
A PDF with step-by-step instructions and a link to the tracker. Open the link, copy the sheet to your own Drive, and start entering holdings. The email arrives as soon as the payment clears, and the download link is valid for seven days, so save the file.
The same email carries your personal access key. The setup guide shows where it goes in the sheet — it is what lets your European listings price. It does not expire.
More on why tracking your own performance matters here.