Wheel Strategy Results: 8 Months of Real Trades
Published
Eighteen contracts. Eight months. One stock. Here is every option I sold on Interactive Brokers, what it paid, what it cost, and why doing nothing at all would have paid me more.

Eighteen contracts. Eight months. One stock. Here is every option I sold on Interactive Brokers, what it paid, what it cost, and why doing nothing at all would have paid me more.
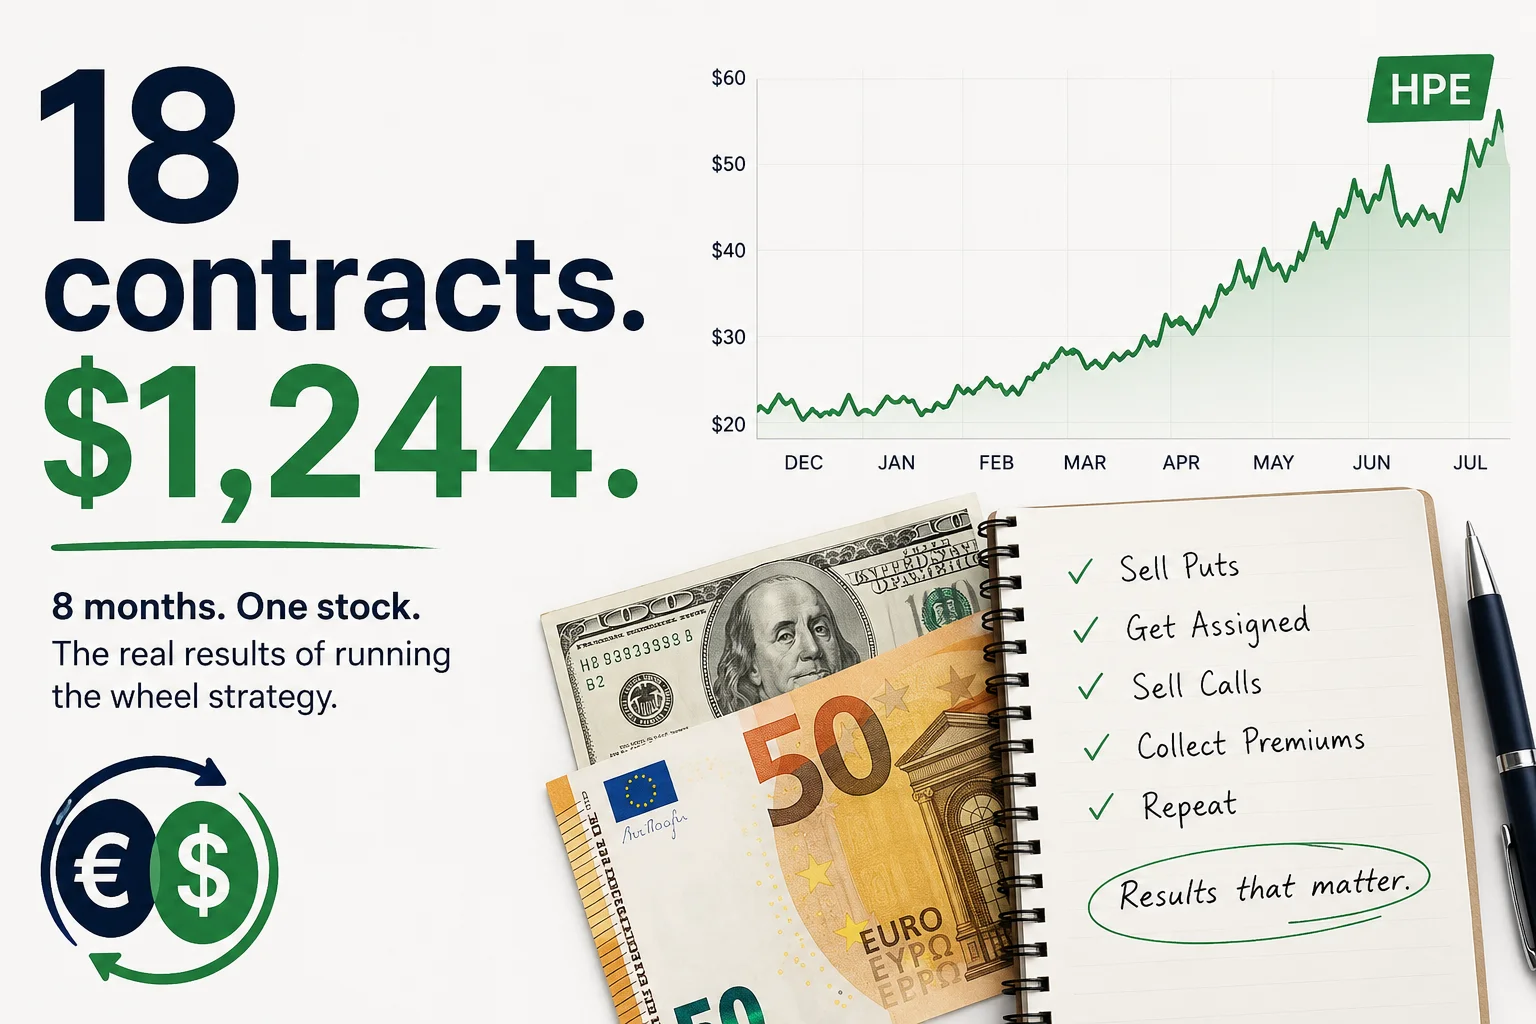
I Sold Options on One Stock for 8 Months. Here Is Every Trade.
Eight months. Eighteen option contracts. One stock.
Net result: $1,244.55, or about €1,150 in my base currency once you include the currency gain from holding dollars.
Buying 100 shares of the same stock on the same day and doing absolutely nothing: about $2,554.
That is the whole article in two lines. If you want to know how a strategy that made money on seventeen of eighteen positions still finished with less than half of buy and hold, keep reading. Every trade is below, including the fees, the one that lost money, and the two that cost me the most without technically losing anything.
I explained how the wheel strategy works, step by step with screenshots, in my wheel strategy guide. This article is the other half: what actually happened when I ran it with real money.
The setup
The stock was HPE (Hewlett Packard Enterprise). Established company, liquid options, a price that fit my account size, and a business I was comfortable holding if things went sideways. Exactly the profile I describe in the guide.
I ran everything from a regular Interactive Brokers cash account with a EUR base currency. No margin. The capital committed at any one time ranged from roughly $2,300 early on to about $6,100 at the peak. Measured against that peak commitment, $1,244.55 works out to around 20% over eight months. Measured against buy and hold on the same stock, it was a clear second place. Both numbers are true. Keep both in mind.
The period runs from 3 December 2025 to 31 July 2026.
Every option contract, in one table
Premium is what I collected when I sold the contract. Net is what was left after commissions and any buyback cost. One position is still open as I write this.
Opened | Contract | Premium | Outcome | Net |
|---|---|---|---|---|
03 Dec | Dec 20.5 Put | $33 | Expired | +$32.04 |
05 Dec | Dec 24 Call | $30 | Assigned | +$28.98 |
08 Dec | Dec 23 Put | $16 | Expired | +$14.98 |
15 Dec | Dec 23.5 Put | $48 | Expired | +$47.04 |
29 Dec | Jan 23 Put | $32 | Assigned | +$31.23 |
29 Dec | Jan 23.5 Put | $47 | Assigned | +$46.23 |
26 Jan | Feb 23 Call | $25 | Expired | +$24.30 |
28 Jan | Feb 23.5 Call | $36 | Expired | +$34.95 |
02 Mar | Mar 24 Call | $52 | Expired | +$51.20 |
12 Mar | Apr 23 Call | $56 | Assigned | +$54.95 |
23 Mar | Apr 23.5 Call | $48 | Bought back at $105 | -$58.75 |
14 Apr | May 25 Call | $104 | Assigned | +$103.30 |
21 Apr | May 26.5 Put | $60 | Bought back at $7 | +$51.15 |
07 May | May 29 Put | $47 | Expired | +$45.94 |
18 May | Jun 30.5 Put (x2) | $224 | Bought back at $4 | +$217.49 |
03 Jun | Jun 50 Put | $127 | Assigned | +$126.44 |
24 Jun | Jul 53 Call | $239 | Expired | +$237.94 |
21 Jul | Aug 52 Call | $170 | Still open | +$168.95 so far |
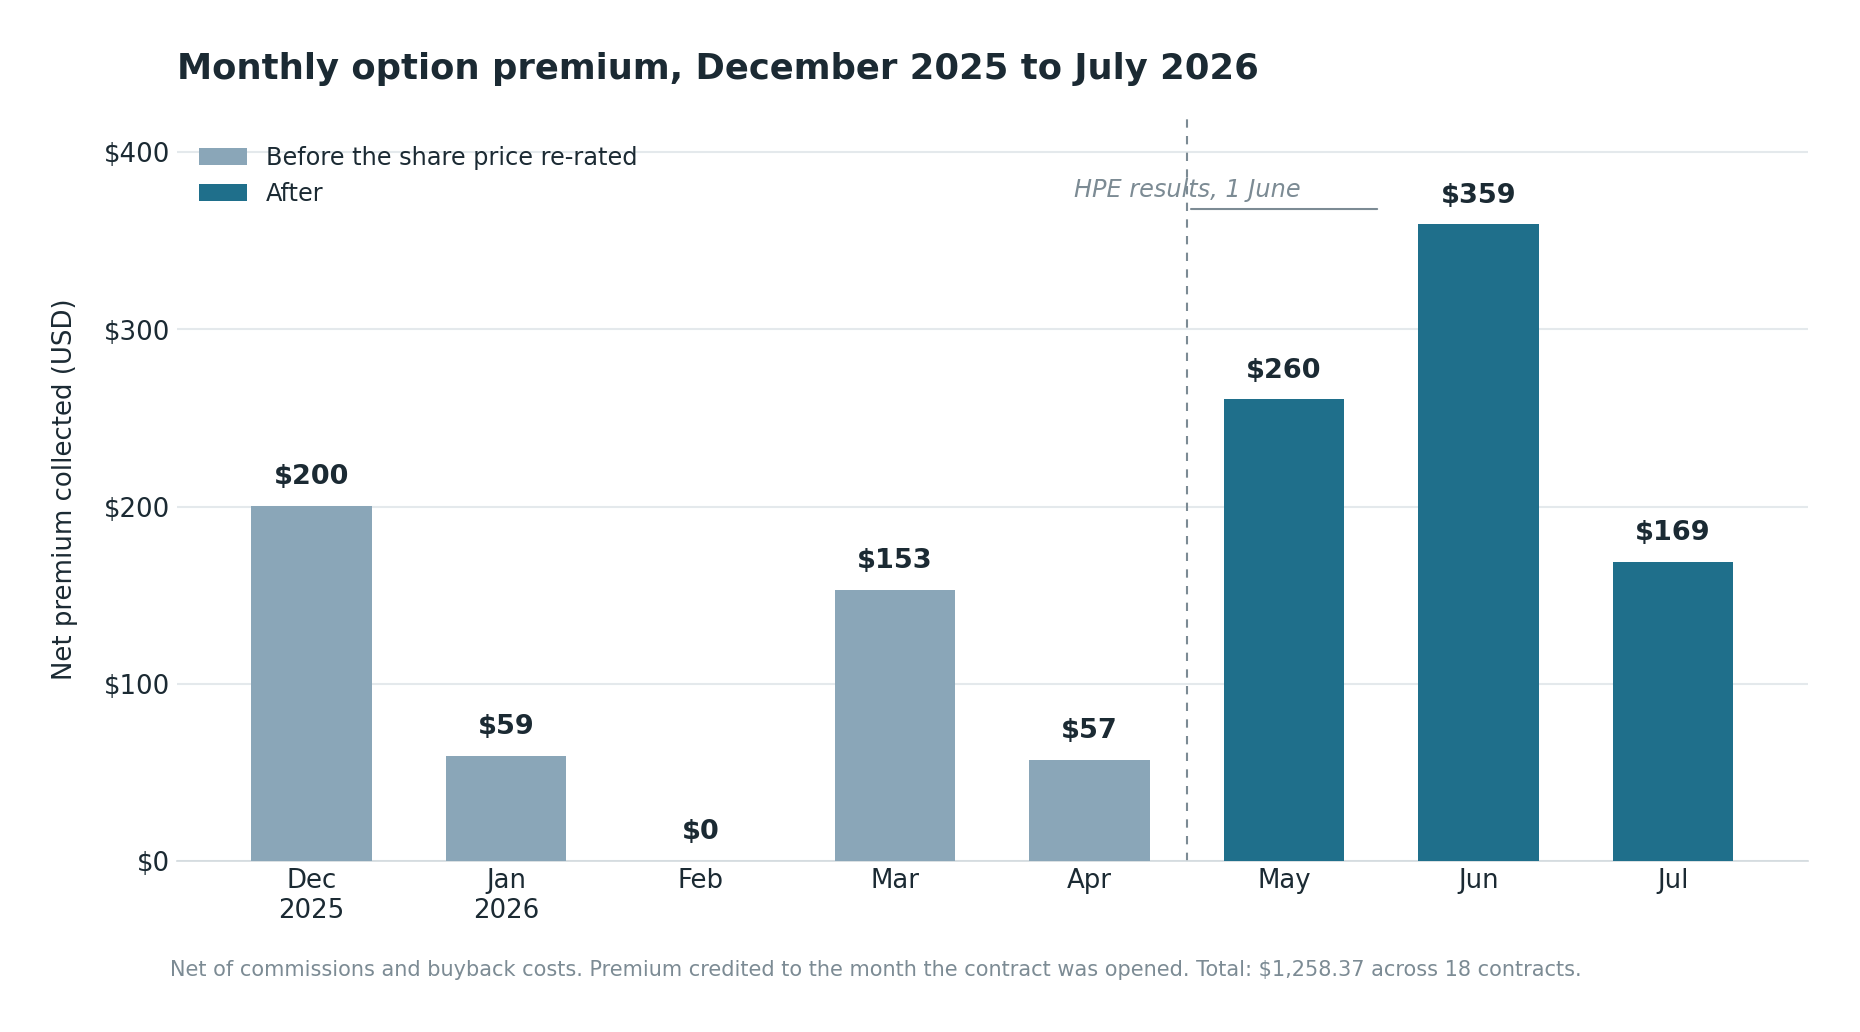
Net premium collected each month. The three darker bars come after the share price re-rated, when higher volatility pushed premiums up sharply
The totals:
USD | |
|---|---|
Gross premium collected | $1,394.00 |
Buyback costs | -$116.00 |
Commissions on options | -$19.63 |
Net premium | $1,258.37 |
Stock trading result, including the open position marked to market | +$470.93 |
Dividends received, after 15% US withholding | +$36.33 |
Open call marked to market instead of counted as cash | -$129.94 |
Mark on the current 100 shares | -$210.00 |
Total result | $1,244.55 |
A note on that total: the open call and the shares I currently hold are valued at market prices on 31 July, not at what I paid or received. That is the honest way to count it. If I only counted cash that has landed, the number would look better and mean less.
The fees are not the story
Total commissions across 21 option legs and all the stock trades: $19.83. That is 1.4% of the gross premium. The average option trade cost me 94 cents. Assignments and expirations cost nothing at all.
Whatever criticism this strategy deserves, cost is not on the list. If you have read my Interactive Brokers review, this is why I keep using them for options.
The put side worked exactly as advertised
I was assigned on puts three times: twice in January at $23.50 and $23.00, and once in June at $50.
The January assignments are the textbook case. I collected premium for agreeing to buy a stock I wanted anyway, at prices I had chosen, below where it was trading when I sold the contracts. The stock recovered, I sold calls against the shares, and the shares eventually left at a profit.
This is the argument for the wheel, and my numbers back it up. When you sell puts on a stock you genuinely want to own, at strikes you would genuinely pay, assignment is not a failure. It is the strategy handing you inventory.
The June assignment at $50 is the same logic under worse light. As I write, those shares sit at $47.90, an unrealised loss of $83.56, and I am selling calls against them at strikes above my cost. Ask me in six months how that went.
The call side is where the money leaked
Here is the part most income-strategy articles skip.
Between December and March, HPE traded in a range between roughly $20 and $26. Every call I sold either expired worthless or got assigned close to where I sold it. The machine worked. Premium came in every month and nothing hurt.
Then the stock started moving. In April, 100 of my shares were called away at $23. In May, another 100 left at $25. On both trades I made money: the shares went out above my cost, and I kept the premium on top.
Those 200 shares are worth $47.90 each today.
Held instead of called away, they would be worth about $9,580 against roughly $4,650 of cost. That difference, close to $5,000 on the two lots, is not a loss on any statement. No line item records it. But it is the real price I paid for eight months of premium, and it is several times larger than everything the strategy earned.
This is the asymmetry inside the wheel that took me real money to understand. A put assignment gives you shares you chose at a price you chose, and you can wait. A call assignment takes your shares at a price the market has already left behind, and there is no waiting your way back. Calls only get exercised when the stock has gone up. The mechanism that pays you monthly income is the same mechanism that guarantees you will not be fully on board for a big move.
For four and a half months, while the stock went nowhere, I was ahead of simply holding. Then HPE reported a blowout quarter at the start of June, the share price re-rated hard, and the comparison flipped in a fortnight. It never flipped back.
I want to be precise about what this means, because it is not "the wheel failed." The strategy did exactly what it is designed to do: convert uncertain upside into certain income. I received the income. I gave up the upside. On a stock that roughly doubled in my holding window, that trade-off was expensive. On the sideways stock I thought I owned, it had been profitable. Nobody rings a bell when one becomes the other.
The trade I got right
Not everything on the call side was a leak. On 14 April, with the stock pushing through my $23.50 strike, I bought that call back at a $58.75 loss and sold a May $25 call for $103.30 in the same minute.
That single decision, called rolling up and out, netted $44.55 in premium and moved my sell price $150 higher on the shares. It is the only position in the table showing a loss, and it was one of the better trades of the eight months. A red number on a statement and a bad trade are not the same thing.
Three things nobody told me about doing this from Europe
Assignment can happen before your dollars do. Twice, an assignment hit my account while my cash was still sitting in euros. My USD balance went negative by over $2,000 each time, and IBKR automatically converted euros to cover it. It resolved itself within a day at a fair rate. But the first time you see a negative cash balance you did not create, it gets your attention.
I sold two contracts without being sure I could. In May I sold two puts at once, a $6,100 obligation, with about $5,350 in dollars. I assumed my euro balance would count towards covering the rest. It did. But I want to be honest: I was not certain at the time, and I have not had that mechanism confirmed by the broker in writing. If you run a multi-currency cash account, check how your broker treats cross-currency coverage before you find out live. I got away with a question I should have asked first.
Check your withholding rate. My US dividend withholding was 15%, not 30%, because the W-8BEN form on my IBKR account applies my country's tax treaty rate. If your statement shows 30% coming off US dividends, a missing or expired form is the likely reason, and fixing it takes minutes.
One thing this article deliberately does not cover: how option premiums are taxed where you live. The treatment varies a lot between European countries, and a blanket claim would be wrong for most readers. Treat the premium as taxable until a local adviser tells you otherwise.
What I would do differently
Two things, and neither is "stop selling options."
I would stop reloading instantly. Look at the table again. Almost every time a contract expired or closed, the next one opened within days, sometimes within the hour. Selling the next option immediately was a habit, not a decision. There were weeks when waiting for a better price, or simply not trading, was the stronger move. Income strategies quietly train you to always be in a position. You do not have to be.
I was too conservative on strikes. Many of my early contracts collected $25 to $50 while safer strikes sat close by paying meaningfully more. Being careful felt responsible. Compounded over months, it mostly meant working the same risk for less pay. There is a version of caution that protects you and a version that just underprices your time. I ran the second one for a while.
So is it worth it?
Here is my honest scorecard after eight months.
The wheel delivered what it promises: steady income, cheap to run, mechanically simple, and psychologically easy because something pays you every month. On a sideways stock, it beat holding, and not by a little.
What it cannot do is let you keep a winner. If the stock you picked precisely because it was solid turns out to be better than solid, the strategy will hand your shares to someone else near the bottom of the move and pay you pocket money for them. My $5,000 of foregone gains against $1,244 of income is what that looks like in practice.
I am still running it. But I now think of the premium as rent I collect for capping my own upside, not as free income on shares I own. Price the cap honestly and the strategy makes sense in the right conditions. Ignore the cap and every month will look like a win right up until the one that quietly is not.
If you are starting from zero, read the wheel strategy guide first for the mechanics, then come back to this page before you sell your first contract. The table above is the part I wish someone had shown me.
Frequently asked questions
How much did you make selling options over 8 months? Net of all commissions and buybacks, $1,258.37 in option premium, and $1,244.55 in total once stock trades, dividends and market values of open positions are included. In euros, about 1,150 including currency effects.
Did the wheel strategy beat buy and hold? No. Buying and holding the same 100 shares over the same period would have returned about $2,554. The wheel was ahead while the stock traded sideways, then fell behind permanently when the stock re-rated and shares were called away.
What were the total fees for 18 option contracts on Interactive Brokers? $19.83 in total, about 94 cents per option trade. Expirations and assignments carried no fee.
Is put assignment a problem in the wheel strategy? Not if the strike is a price you would genuinely pay for a stock you genuinely want. Assignment on the put side gives you chosen shares at a chosen price. The bigger hidden cost in this account came from the call side, where rising shares were sold away below market.
Can you sell options from a cash account without margin? Yes. Every trade in this article was placed in a standard Interactive Brokers cash account. Puts must be fully cash-secured, and with a multi-currency account you should confirm how the broker treats coverage across currencies before selling contracts that stretch a single currency balance.
This article describes my personal trades and their actual outcomes for educational purposes only. It is not financial advice, not a recommendation to trade options, and not a prediction that these results can be repeated, by me or anyone else. Options involve significant risk, including the loss of capital and, on the call side, the loss of further gains on shares you own. Results cover a single stock over a single eight-month period and say nothing about other stocks or other periods. Tax treatment of option premiums and dividends varies by country. Consider speaking with a qualified financial professional before trading.