Track Your Portfolio and Dividends in Google Sheets (2026 Edition)
Published
Portfolio and Dividend Tracker: why tracking your portfolio matters, and how to do it in one Google Sheet - dividends, returns and European ETFs included.
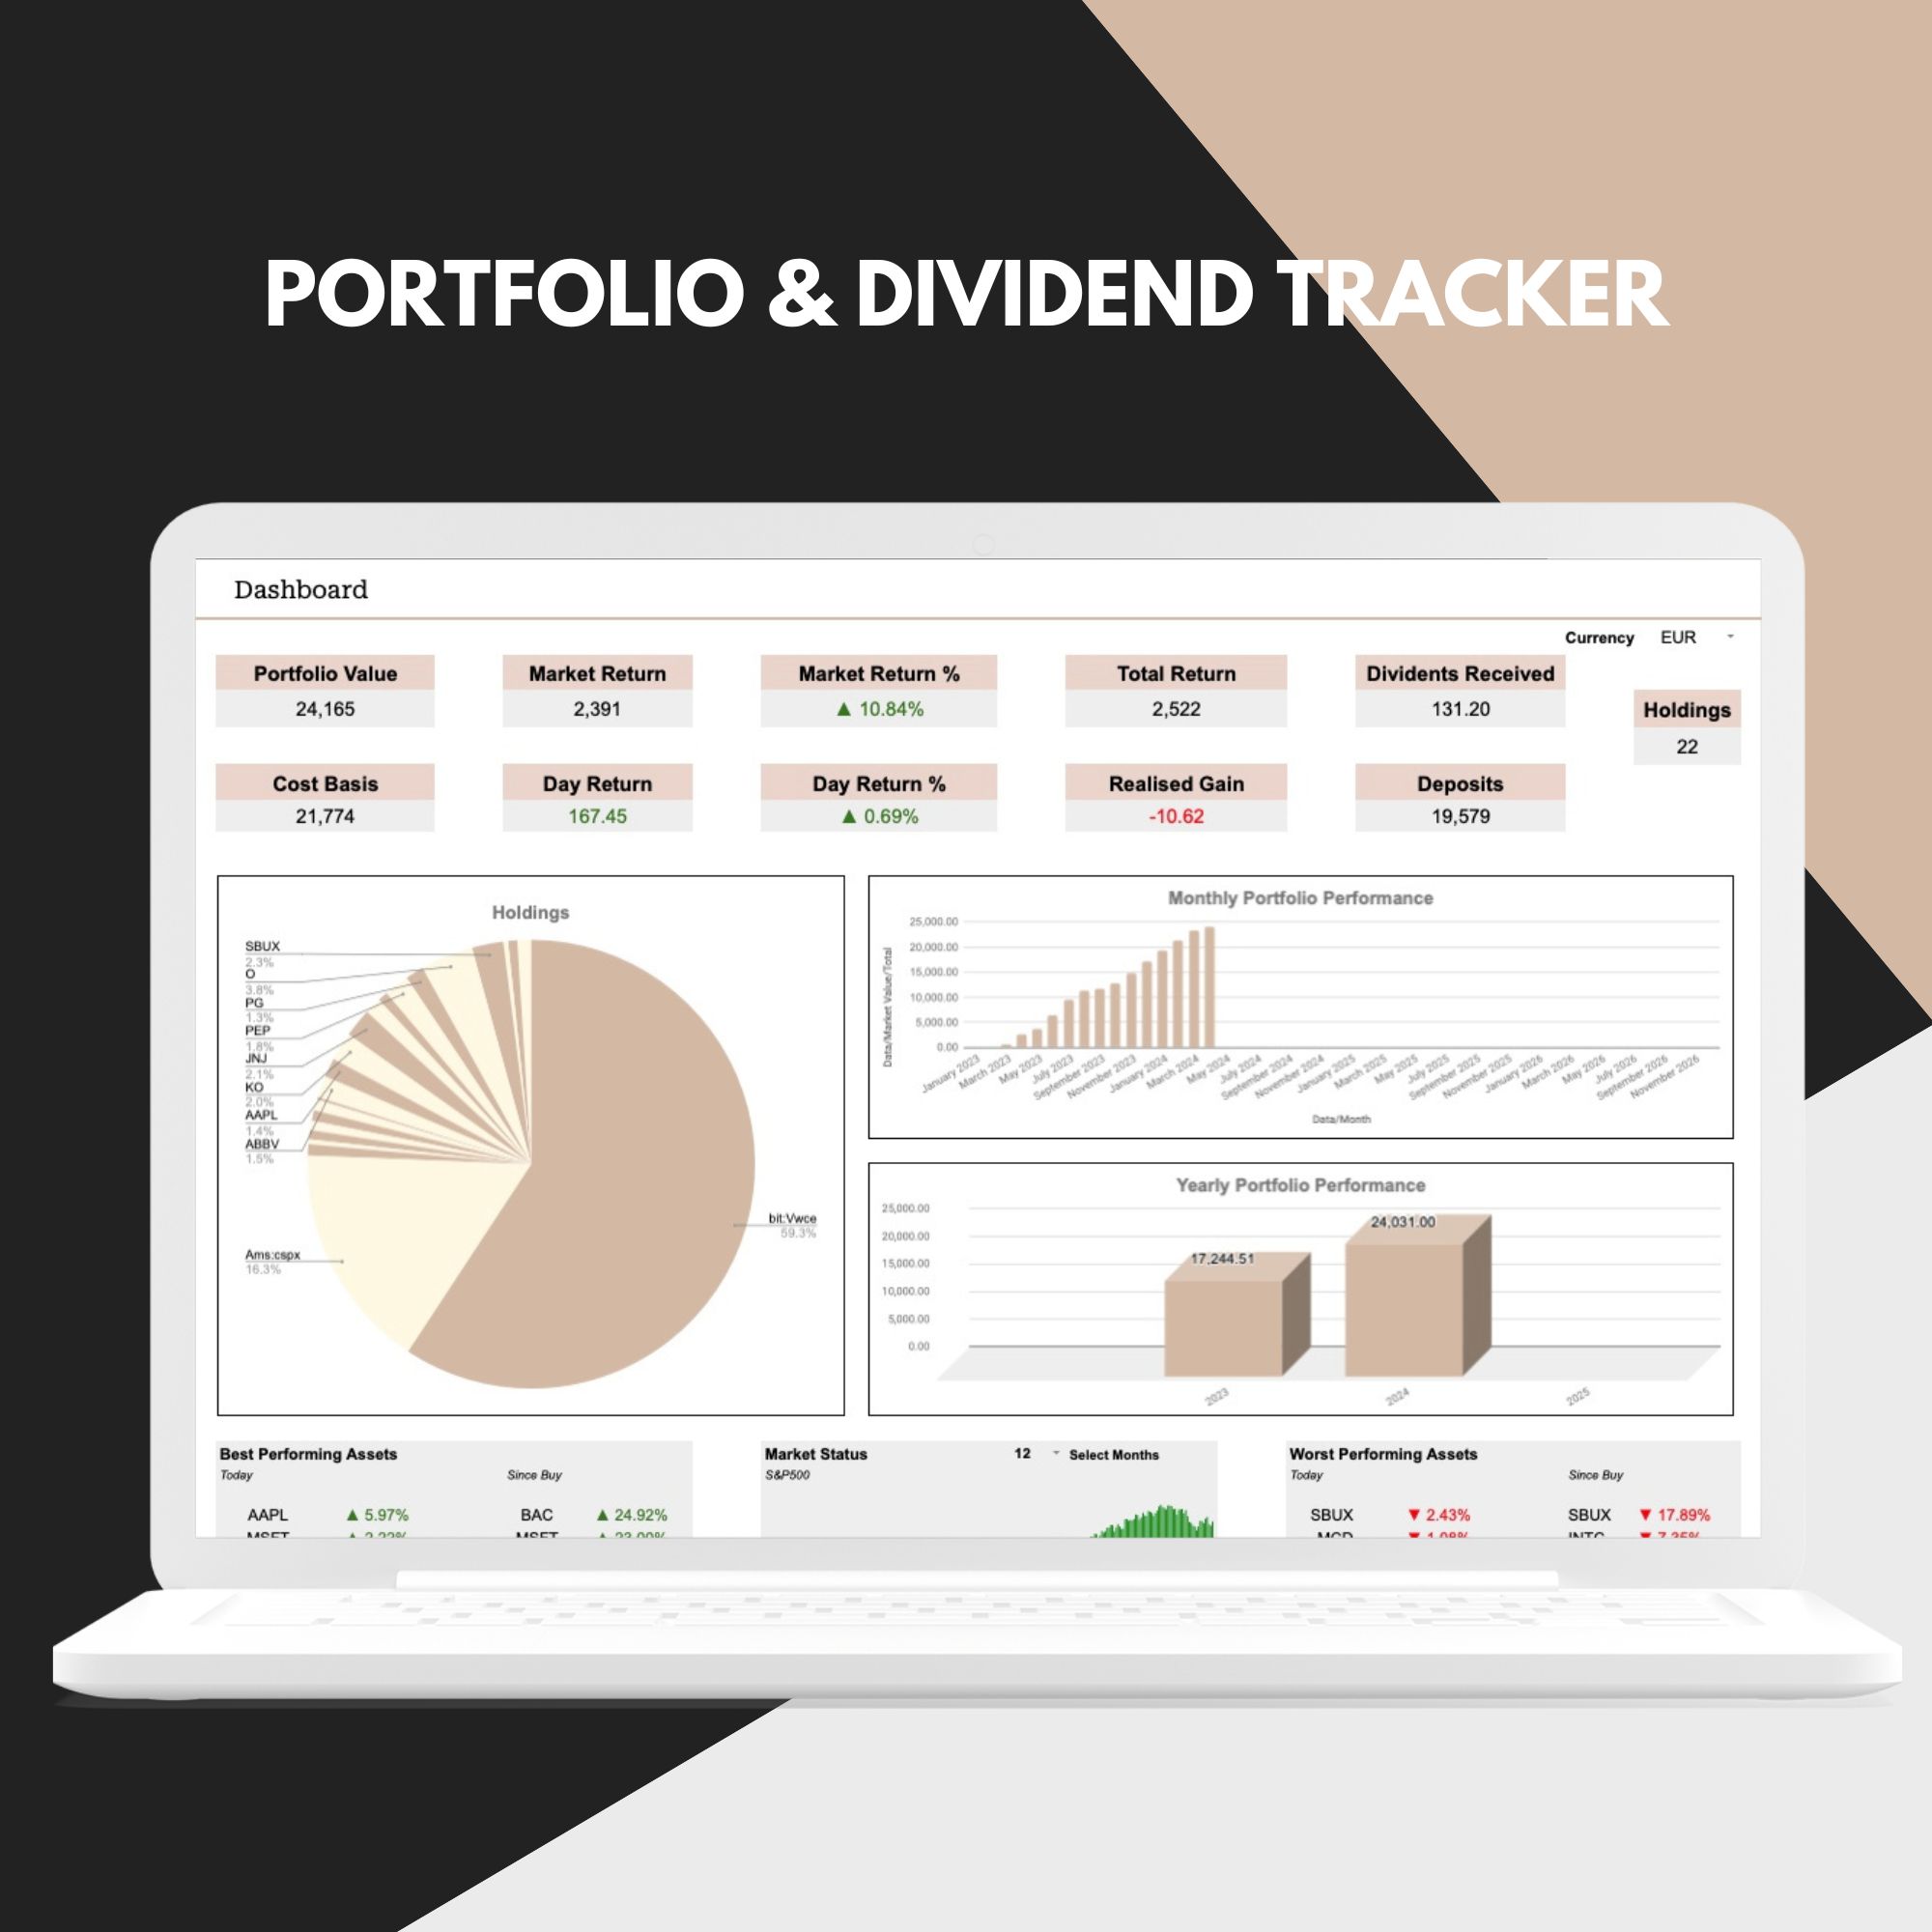
For stock investors, keeping a close eye on the performance of their portfolio is not just a good practice. It's essential. Whether you're just starting your investing journey or you are in investing for a long time now, monitoring your investments allows you to make informed decisions, identify trends, and ultimately maximize your returns.
Tracking the performance of your portfolio provides valuable insights into how your investments are performing relative to the market and your financial goals. It enables you to assess which stocks are thriving and which ones may need adjustment. By regularly reviewing your portfolio, you can spot potential opportunities and risks, allowing you to adjust your strategy accordingly.
While there are numerous tools available on the internet that offer portfolio tracking services, many of them come with a monthly subscription fee. However, there's another option that's often overlooked but equally effective: custom spreadsheets.
Custom spreadsheets offer investors a highly customizable and flexible way to track their portfolio performance. With a spreadsheet, you have complete control over the data you input and how it's analyzed. You can tailor it to your specific needs, adding or removing metrics as necessary. Whether you prefer simple charts or complex formulas, a spreadsheet can accommodate your preferences.
This tool was born from my own frustration with scattered investment reports and a lack of consolidated dashboards. As a passionate long-term investor, I wanted a single place where I could track my progress, analyze different aspects of my portfolio, and make informed decisions. This Google Sheet based tool is the result – it puts everything I need as an investor right at my fingertips.
Here's a breakdown of the 7 tabs included in the Portfolio and Dividend Tracker:
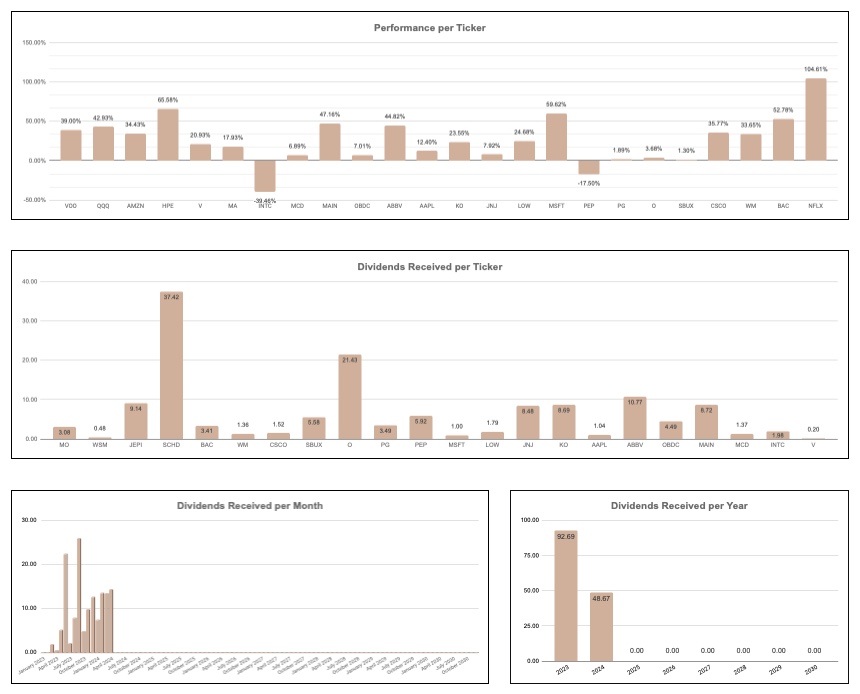
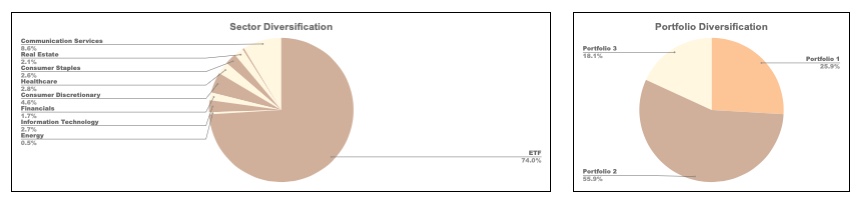
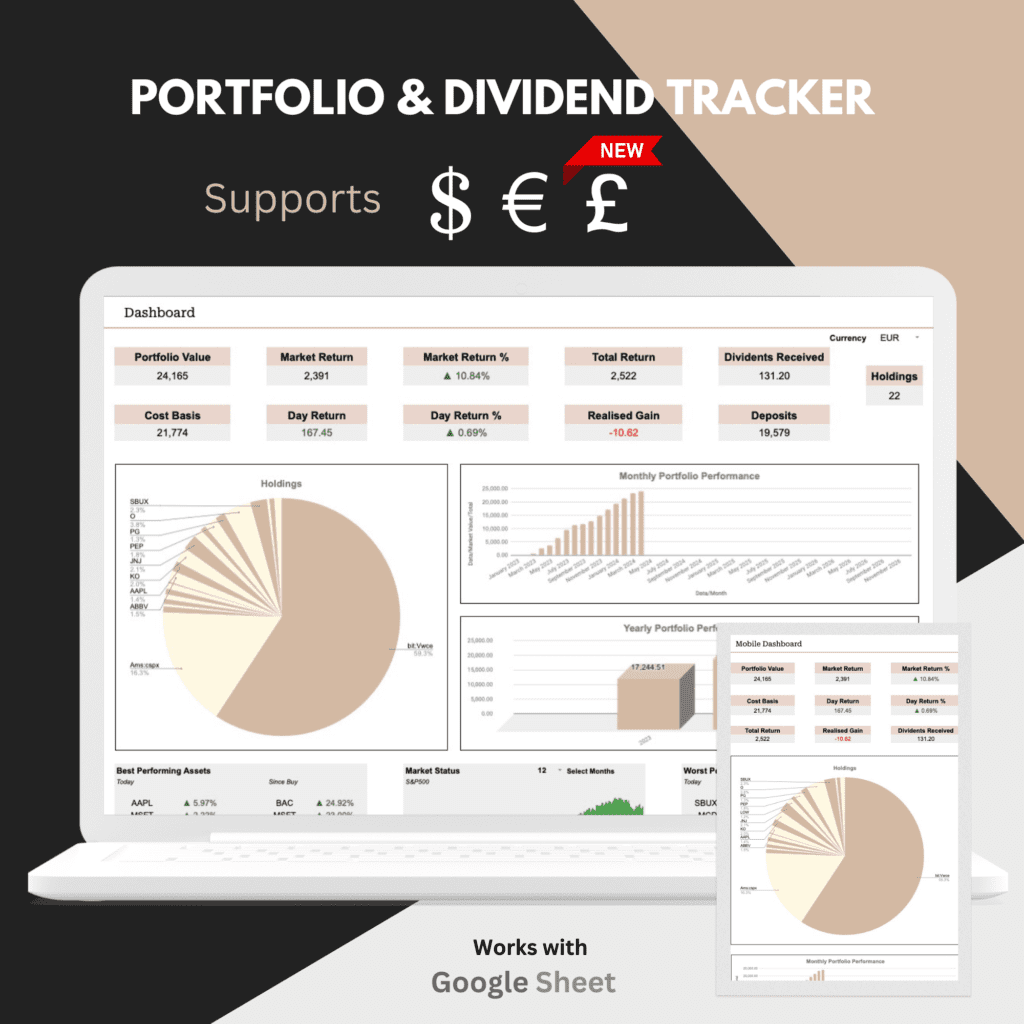
Dashboard View: This is your central hub where you can see everything at a glance. Track your overall portfolio performance, including how your investments are doing month-to-month and year-to-year. You can also set and track a yearly goal for your investments, monitoring progress to stay on target. See how much in dividends you've received from each stock you own, again broken down by month and year. Keep an eye on daily and all-time winners and losers to spot top performers and underachievers quickly. Worried about diversification? This tool can show you how your portfolio is spread across different sectors, giving you peace of mind that you're not putting all your eggs in one basket! If you invest internationally, you can easily switch between €, £ and 💲 for a truly global view of your portfolio.
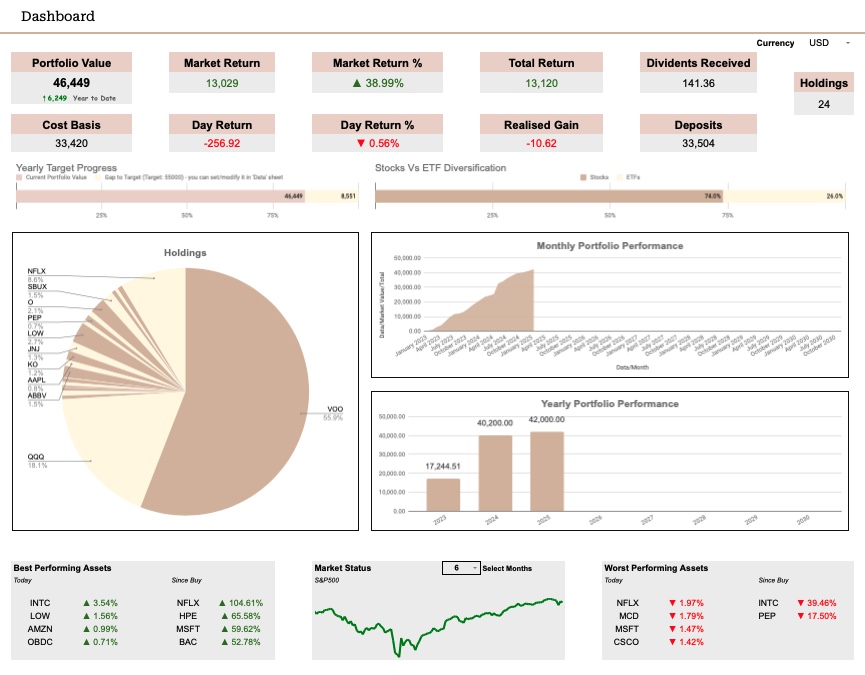
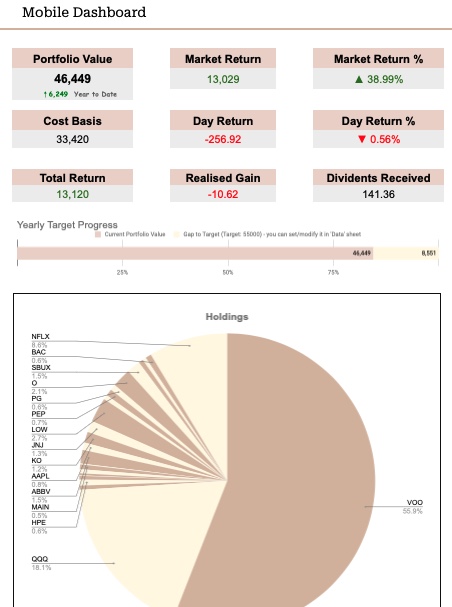
Mobile Dashboard: Life is busy, and you might not always be at your computer. The mobile dashboard gives you the same key insights as the main dashboard, but it's formatted perfectly for your phone or tablet, allowing you to check on your investments on the go!
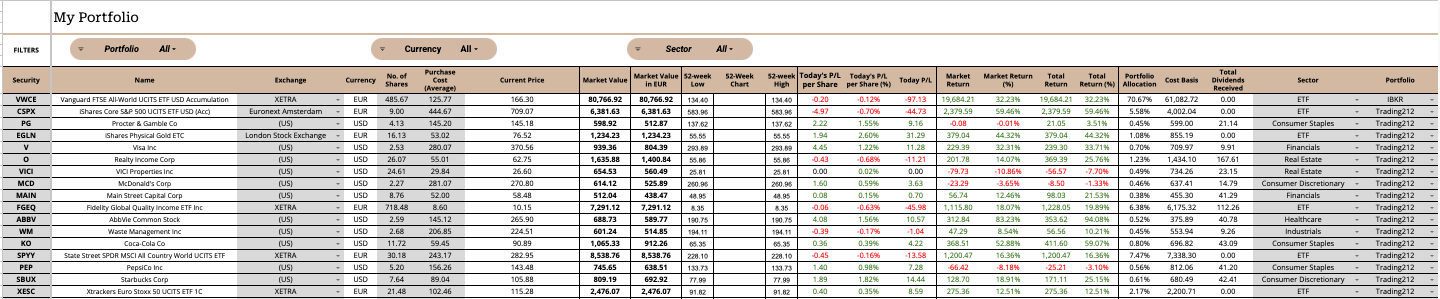
My Portfolio: This is where you dive into the detail. A clear breakdown of each portfolio - your current holdings, and exactly how much each one has gained or lost today and over the long haul, alongside its current price.
US tickers price through Google Finance. European listings are handled separately, because that is where most spreadsheet trackers stop: paste a Xetra, London or Amsterdam ticker and the sheet fills the price in for you, refreshed through the trading day.
Why European ETFs break most spreadsheet trackers
If you have ever built your own tracker in Google Sheets and hold anything listed outside the US, you already know the problem. GOOGLEFINANCE handles US tickers well. Point it at a European UCITS line and it often returns nothing at all — no error you can act on, just a blank cell or #N/A sitting where a price should be. Your total is quietly wrong, and it stays wrong until you notice.
Workarounds exist and none of them last. Scraping a web page breaks the week the page changes. Typing prices in by hand is fine for three holdings and unbearable for twenty. Switching to a paid tracker means paying every month for something you had almost finished building.
The Portfolio & Dividend Tracker handles those tickers for you. Enter a European listing the same way you enter a US one and the sheet fills the price in, updated through the trading day. Tickers that work include:
VWCE.DE — Vanguard FTSE All-World, Xetra
SXR8.DE — iShares Core S&P 500, Xetra
SPYY.DE — SPDR MSCI ACWI, Xetra
IWDA.AS — iShares Core MSCI World, Amsterdam
VWRP.L — Vanguard FTSE All-World, London
EGLN.L — iShares Physical Gold ETC, London
FGEQ.DE — Fidelity Global Quality Income, Xetra
It is not a fixed list. Enter a ticker the sheet has not seen before and it goes into the queue and starts pricing on the next refresh - which is how most of the listings above got there in the first place, added by people entering their own holdings.
Prices shown in the tracker are indicative and may be delayed. The sheet is a record-keeping tool for your own holdings, not a trading, quotation or valuation service — always check your broker for the price you will actually transact at.
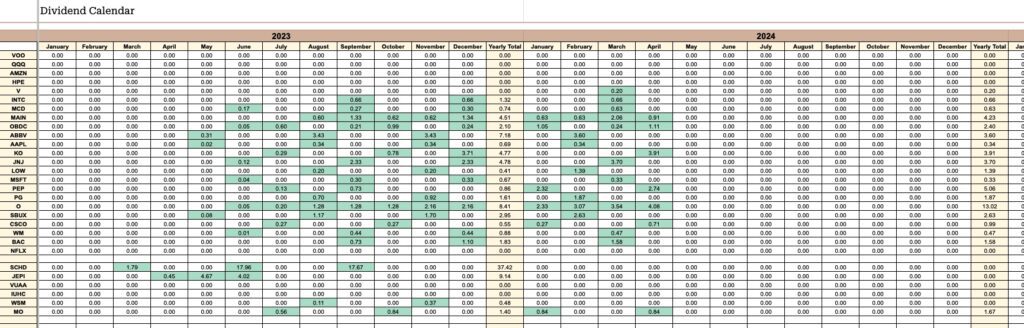
Dividend Calendar: Dividends are like little gifts from your stocks, and this tool keeps track of them all! See a clear calendar showing the history of those sweet dividend payouts. Even better, it automatically highlights dividends you've already received, making it easy to see what's already hit your account. You can also analyze your dividend income by individual stock, month, year, and even see your total dividend haul!
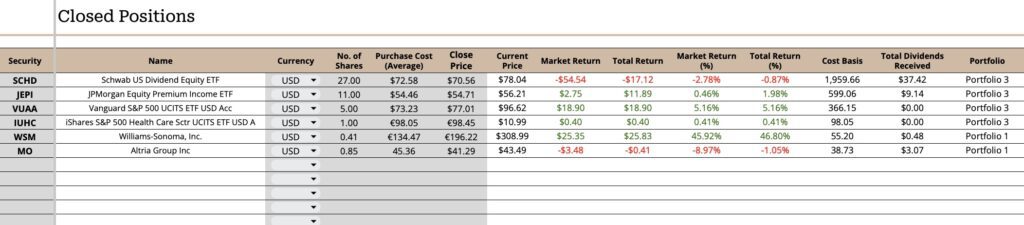
Closed Positions: Ever sold a stock? This tab keeps track of all your closed positions, showing you the gain or loss you made on each sale.
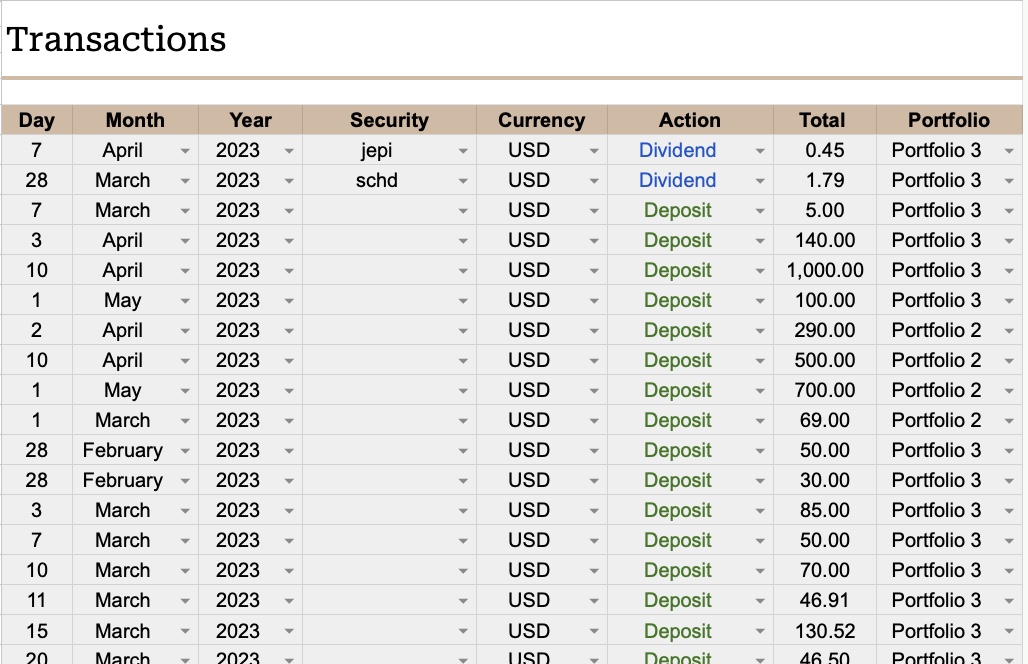
Transactions: This is where you input all your investment activity. Easily enter your deposits and dividends, so the insightful graphs on your Dashboard and Dividend Calendar can be automatically generated for a clear view of your progress.
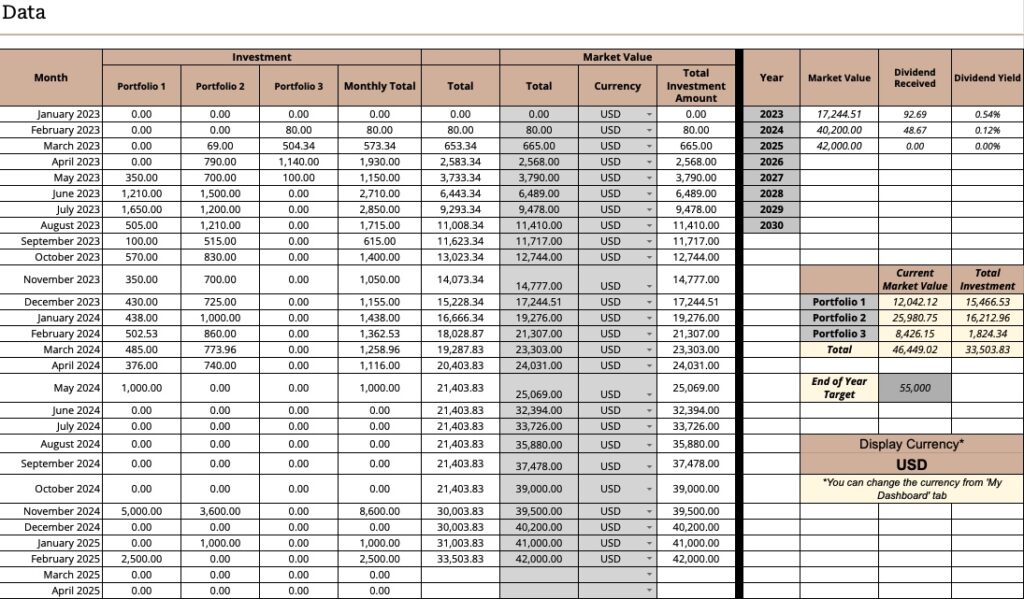
Data: This tab gives you a straightforward, high-level overview of your portfolios, highlighting the total amount you’ve invested and the current market value for each one. It’s designed to handle up to three different portfolios, and you can easily customize their names right here to make things feel more personal. Plus, you can tweak the investment timeframe - like the number of years you’re tracking - to fit your needs. This is also the spot to set your yearly investment goals and keep everything on track.
This tool empowers you to take control of your investments and become your own financial guru!
What you get when you buy it
A PDF with step-by-step setup instructions and a link to the tracker. Open the link, copy the sheet to your own Google Drive, and start entering holdings. The email arrives as soon as payment clears and the download link is valid for seven days.
The same email carries your personal access key. The setup guide shows where it goes in the sheet - it is what switches on pricing for European listings in your copy. It is tied to the email address you bought with and it does not expire.
All you need is a free Google account. No Excel licence, no subscription, no monthly fee - you buy it once and the file is yours.
You can get the Portfolio & Dividend Tracker by using this link.
Disclaimer: The information provided in this article is for educational and informational purposes only and should not be construed as financial advice. Investing in the stock market carries risks, including the potential loss of principal. Before making any investment decisions, it is essential to conduct thorough research and consider consulting with a qualified financial advisor. Additionally, please note that investment platforms and brokers may have specific terms, conditions, and fees that should be carefully reviewed before opening an account or executing trades.