How I Track My Portfolio and Dividends With FolioLens
Published
I built a portfolio and dividend tracker for European investors. Here is what every page shows and what it costs.
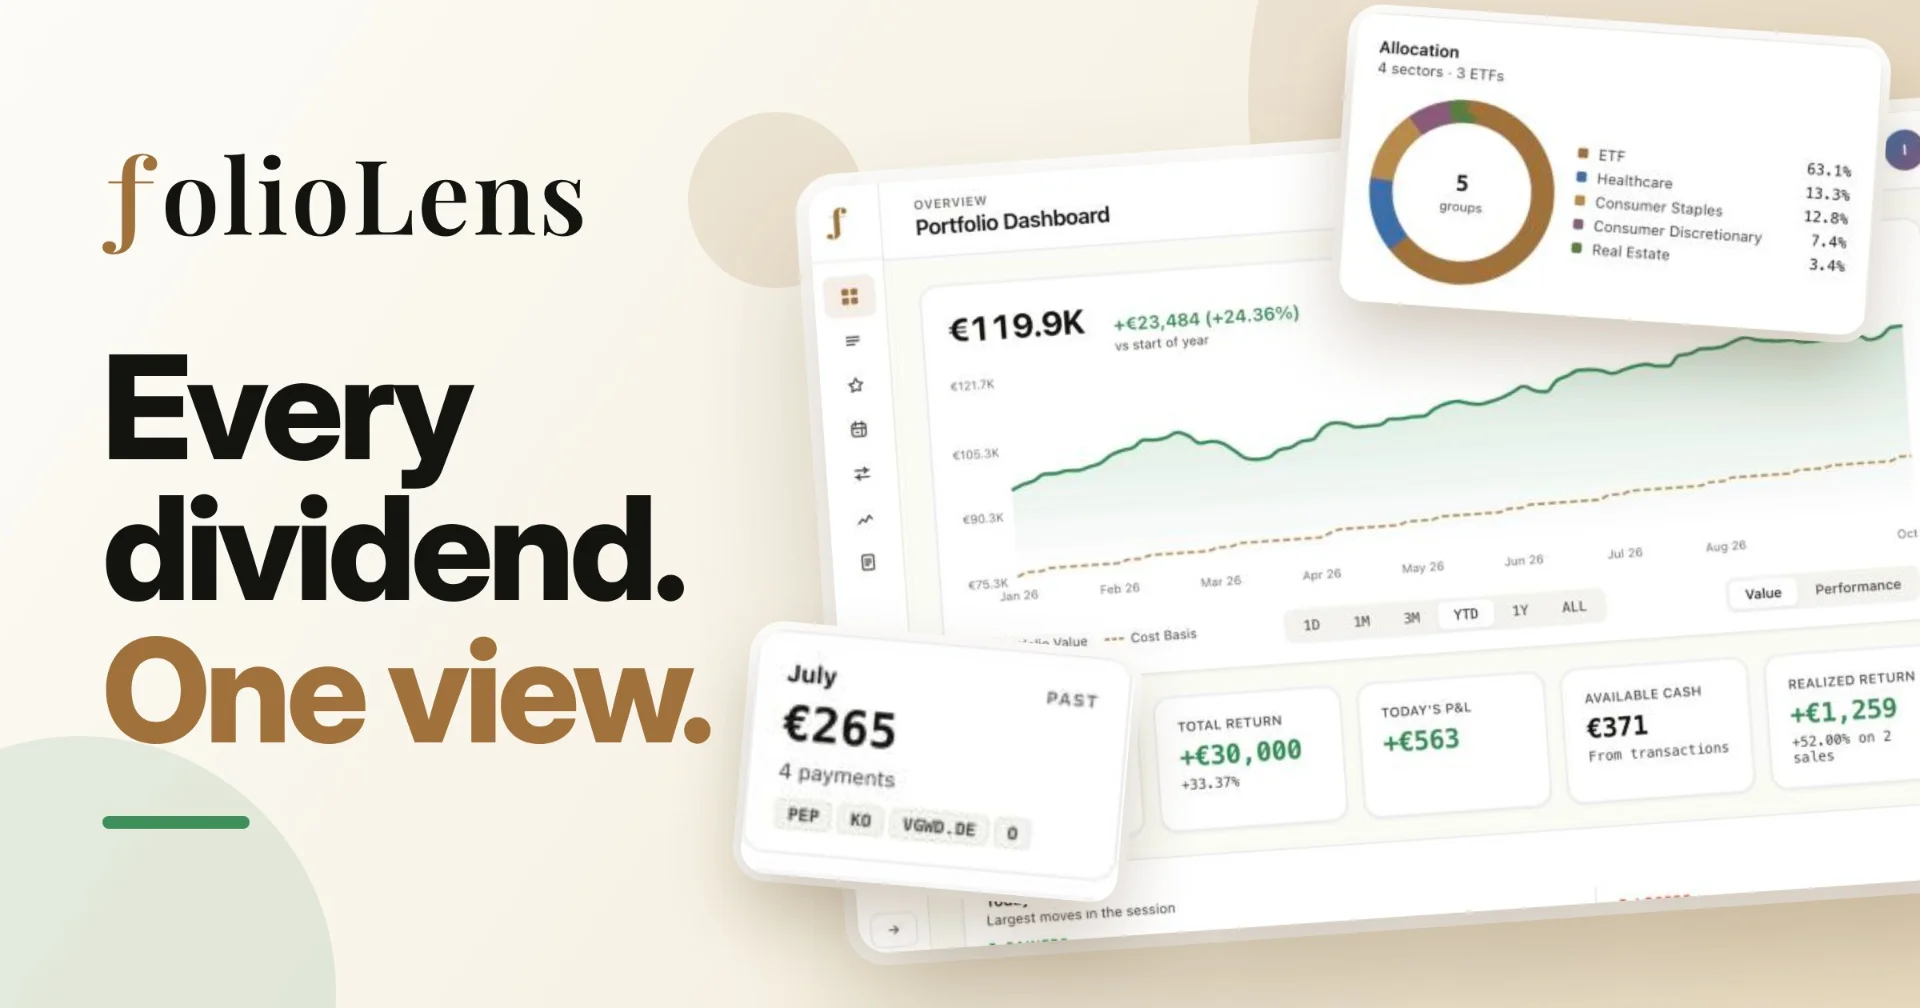
I built FolioLens and I own it. This article shows what it does and how I use it.
I track my portfolio and dividends in FolioLens, a web app I built for European investors who hold UCITS ETFs and shares with more than one broker. FolioLens takes in transactions through a broker connection or a CSV file, then shows value, return, allocation, dividend income and a comparison against the S&P 500 in one place, in EUR, USD or GBP. A spreadsheet is another way to do the job at minimal cost if you prefer to maintain it yourself.
Every screenshot in this article shows a demo portfolio. The holdings and amounts are sample data, not my own accounts.
What FolioLens does
FolioLens is a portfolio and dividend tracker that runs in the browser. You give it your transactions, and it works out what you own, what you paid, what it is worth now and what income it has produced. It does not place trades and it does not hold money.
The app has seven pages. Each one answers a different question.
Page | The question it answers |
|---|---|
Dashboard | What is the portfolio worth, and how did it get there? |
Holdings | What do I own, at what cost, and in which account? |
Watchlist | What am I following but do not own yet? |
Dividends | What income has arrived, and what is scheduled? |
Transactions | What did I buy, sell, deposit and receive, and when? |
Analytics | How does my return compare with the S&P 500, and how concentrated am I? |
Reports | Can I get all of this as a PDF? |
I have used FolioLens for about a year. The demo portfolio in the screenshots is spread over two broker accounts, and FolioLens shows them side by side inside one view. I built it because my own portfolio had outgrown the spreadsheet I was keeping. With positions in euro and in dollars, and dividends arriving most months, I wanted one screen that updated itself and told me what the whole portfolio had returned and what income was coming next.
Getting your transactions in
There are three ways to load a portfolio, and you can mix them.
Connect a broker. Link your account once and your holdings refresh overnight. FolioLens connects to 39 brokers, including Trading 212, Interactive Brokers, DEGIRO, Hargreaves Lansdown and AJ Bell. The connection is read-only and runs through SnapTrade, so FolioLens never sees your broker login and cannot place a trade.
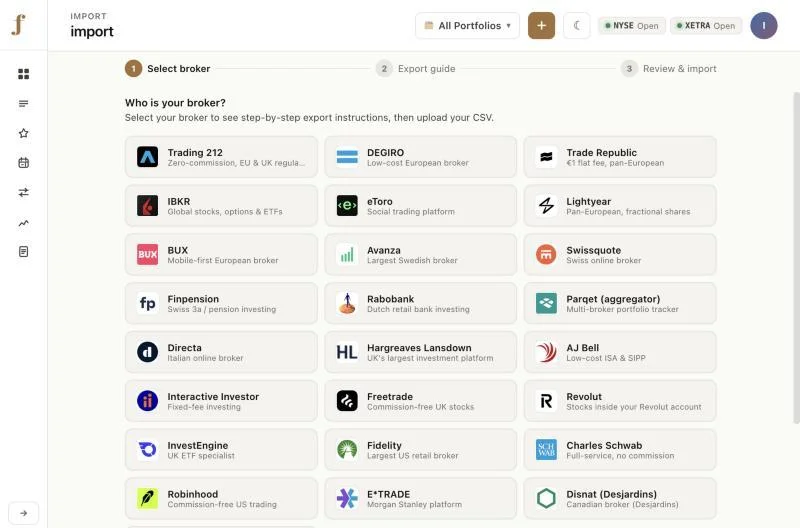
Import a CSV file. It takes three steps. You pick your broker, FolioLens shows how to export the file from that broker, and you review the rows before they are saved. There are ready-made import guides for 24 brokers, including Trade Republic, Lightyear, Freetrade and Revolut, plus an "Other broker" option that reads the columns of any other CSV file.
Add by hand. One form for a buy or a sell, and another for a dividend.
Each account stays a separate portfolio that you can view alone or combined with the rest.
The dashboard
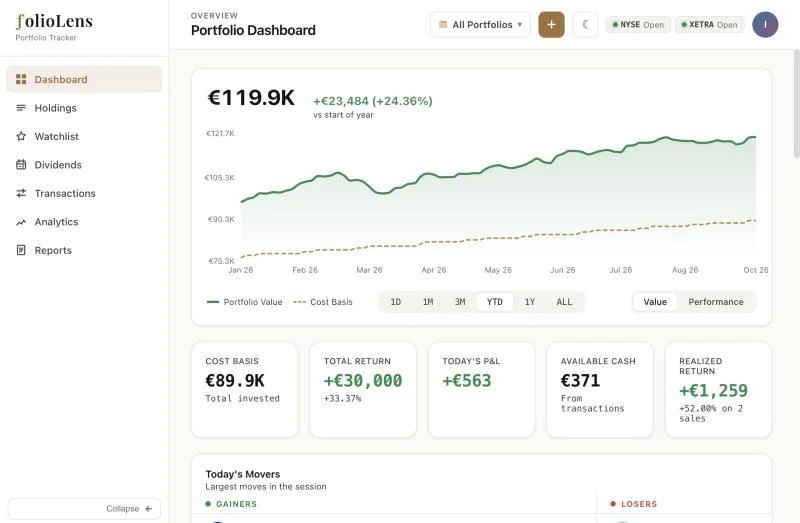
The dashboard opens on one number, the total value, with a chart underneath. Read the dashed line first. That line is your cost basis, the money you actually put in, and the gap between it and the solid line is what the market has added or taken away. You can switch the period from one day to all time, and flip the chart from value to percentage performance.
Below the chart sit five tiles: cost basis, total return, today's change, available cash and realised return from positions you have sold.
Scroll further and the page turns into a set of smaller panels. Today's biggest gainers and losers. A chart of every holding's return with and without dividends, which shows at a glance where income is doing the work and where price is. Your ten largest positions with their weights. Allocation by sector and by account, and total return for each account side by side.
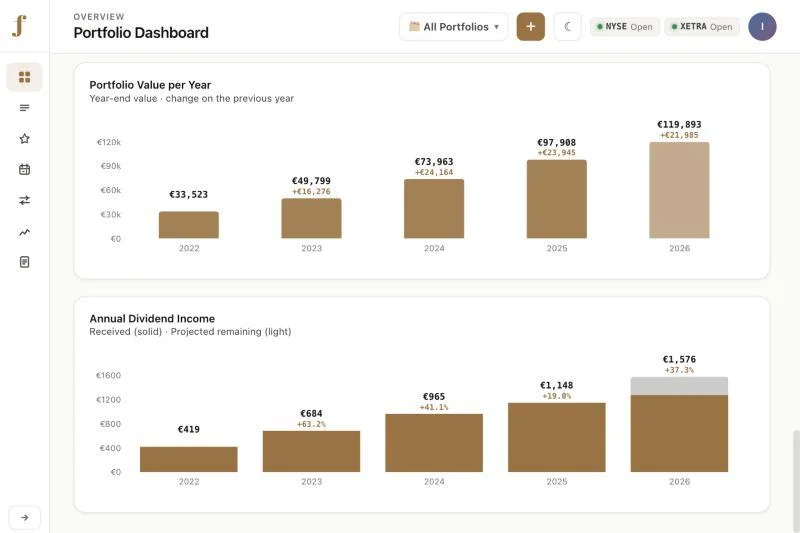
The last two panels are the ones a long-term investor will come back to. One shows the year-end value of the portfolio for every year since you started, with the change on the year before. The other shows dividend income per calendar year, with the current year split into what has been received and what is still projected.
Holdings, transactions and the watchlist
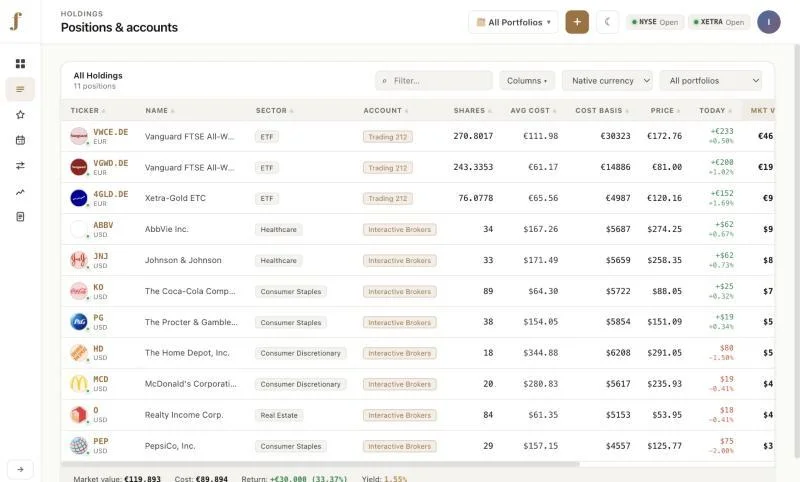
The Holdings page is the table you would otherwise build in a spreadsheet. Each row carries the ticker, sector, account, number of shares, average cost, cost basis, current price, today's move, market value, gain, percentage return, dividend yield and expected annual income. A toggle shows every position in its own trading currency or converts the lot to your display currency. You can hide columns you do not need and filter the table to a single account.
Click a ticker and you get a page for that one instrument. It has a price chart, the exchange and currency, the 52-week high and low, and a second tab with your own position: average cost, market value, gain, and every purchase you ever made in it, listed by date. If you buy the same ETF every month, this is where the whole history of that habit is visible. I wrote about that way of investing in dollar cost averaging for European investors.
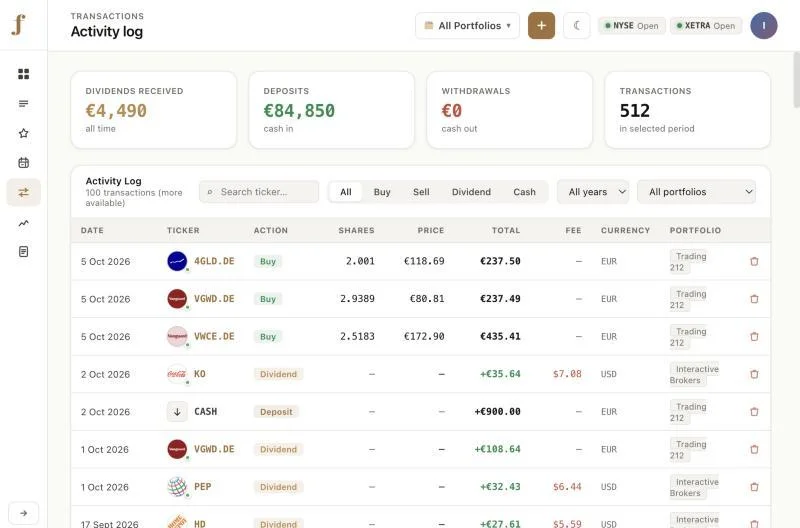
The Transactions page is the full log behind all of it. Buys, sells, dividends and cash movements, filterable by type, year and account, with the fee recorded against each row. Four tiles at the top total the dividends received, deposits, withdrawals and the number of transactions.
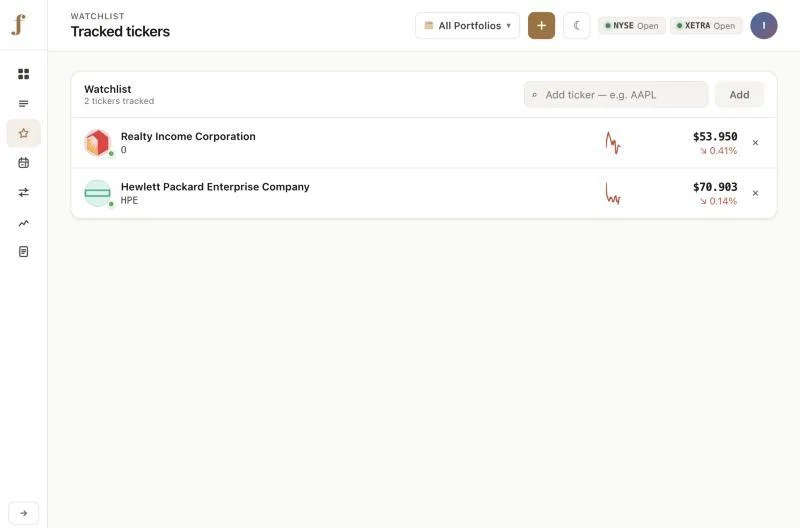
The Watchlist holds the tickers you are following but do not own yet. Add one and it shows the current price, a small trend chart and the day's change, so the ideas you are researching sit in the same app as the portfolio.
The dividends page
The Dividends page is the deepest one in the app.
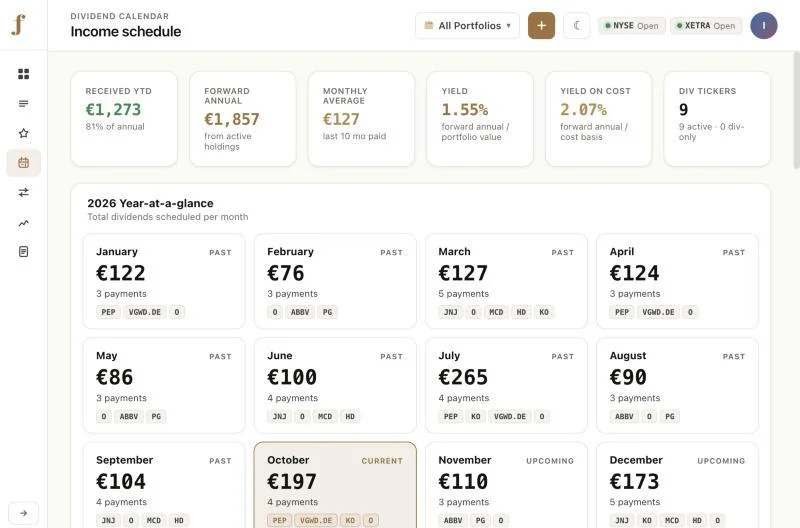
Six tiles run across the top: dividends received this year, forward annual income, the monthly average, the portfolio yield, the yield on cost and the number of holdings that pay. Yield on cost is the forward annual income divided by what you paid, as opposed to what the holdings are worth today.
Under the tiles is a year at a glance. Twelve cards, one per month, each showing the total for that month, how many payments make it up, and which tickers pay. Past months, the current month and upcoming months are marked differently.
Further down you will find a table of upcoming payments with the ex-dividend date, the pay date and the amount per share. Each row is labelled as declared, meaning the company has announced it, or estimated, meaning FolioLens has projected it from the payment history. Next to that sit the holdings that have contributed most income, and a chart of income growth year by year.
Then the heatmap. Holdings down the side, months across the top, and the amount in each cell. Received payments are solid and projected ones are striped, so the gaps and the heavy months show up immediately.
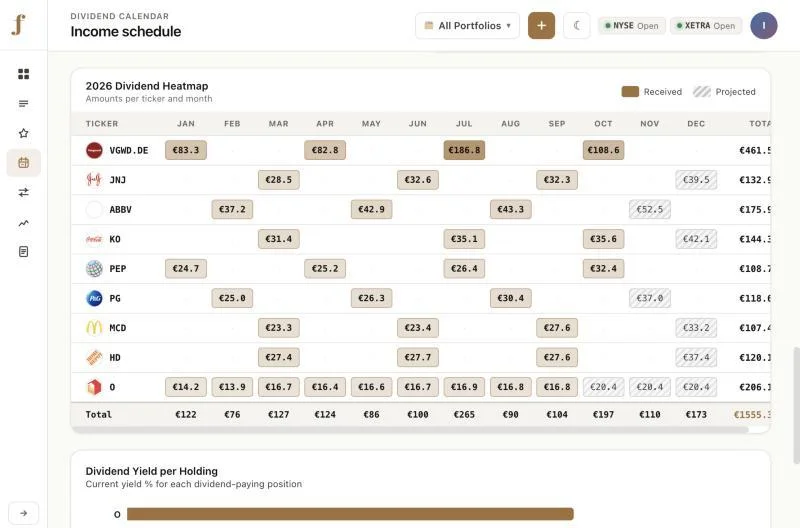
Two cautions. A projected payment is an estimate, and a company can cut or skip a dividend. And an accumulating ETF shows no income here at all, because the fund reinvests its dividends internally and you see the result in the price. If that distinction is new to you, read accumulating vs distributing ETFs for European investors first.
Analytics
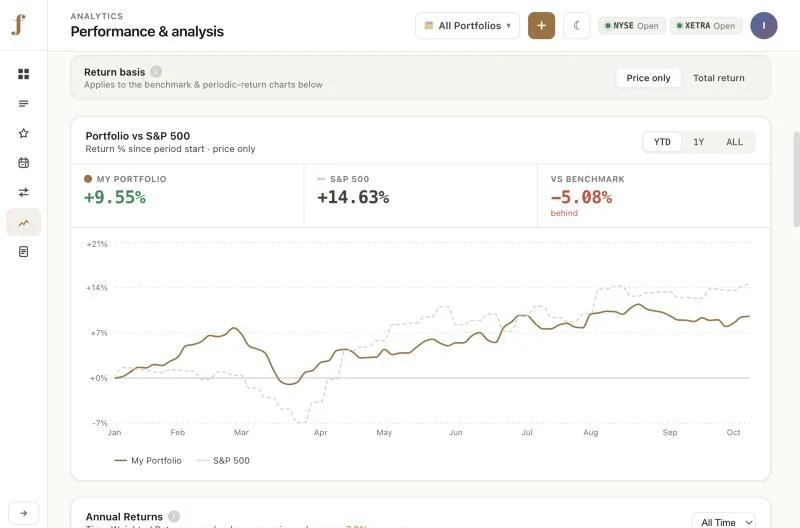
The Analytics page separates two numbers that are easy to blur: total return including dividends, and return from price alone. It then lists your best and worst positions by percentage, losers included.
The main chart compares your portfolio with the S&P 500 over the year to date, one year or all time, on a price-only or total-return basis. It does not flatter you. In the demo portfolio the year-to-date figure is 9.55% against 14.63% for the index, and the page reports the 5.08 point shortfall in red.
Underneath is the annual return for each calendar year, calculated as a time-weighted return. That method removes the effect of when you added money, so a large deposit in March does not make the year look better than it was.
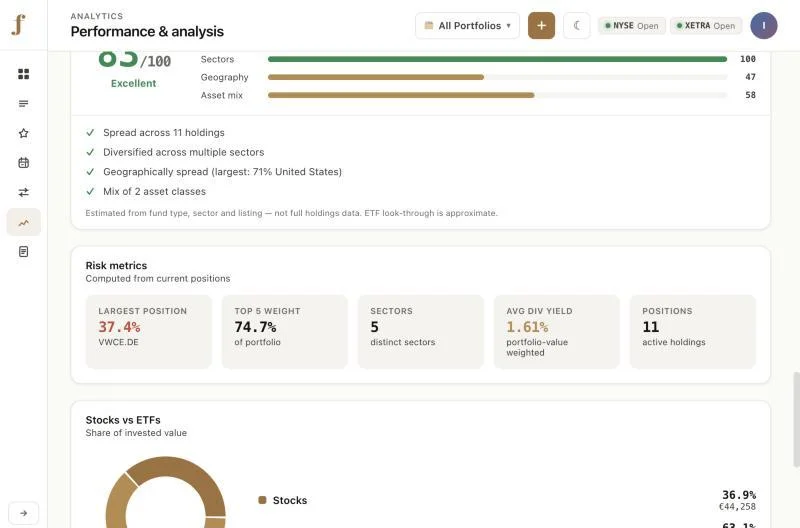
The page ends with concentration. A diversification score out of 100 is built from four parts: breadth, sectors, geography and asset mix. A set of risk tiles gives the weight of your largest position and of your top five together. In the demo the largest position is 37.4% and the top five make up 74.7%. The score is an estimate built from fund type, sector and listing, so use it as a quick check on concentration.
Reports
Two PDF reports are available. The Portfolio Overview covers value, holdings, sector allocation, return by account and annual dividends. The Dividend Status report covers the income figures, the upcoming payments, the top contributors and the heatmap. You can download either one on demand, or have it emailed on the first of each month or once a year.
Neither is a tax report. They summarise what happened in the portfolio, and what you owe on it depends on where you are tax resident.
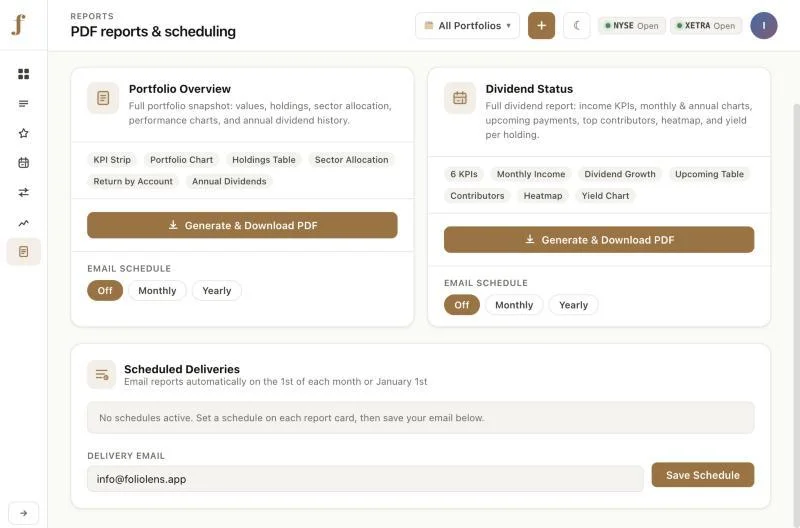
The two PDF reports and the email schedule.
What it costs
FolioLens is a paid subscription, billed once a year. The three plans have the same features and differ only in how many portfolios and people they cover. A portfolio here means one account, so two brokers take two of them.
A new account gets 14 days with every feature and no card. When the trial ends you either choose a plan or the portfolio becomes read-only. Nothing is charged automatically.
A spreadsheet is another way to do it
You do not need an app to track a portfolio. A spreadsheet is another way to do the same job at minimal cost, and plenty of investors prefer it. You own the file, you can see and change every formula, and you pay once or nothing.
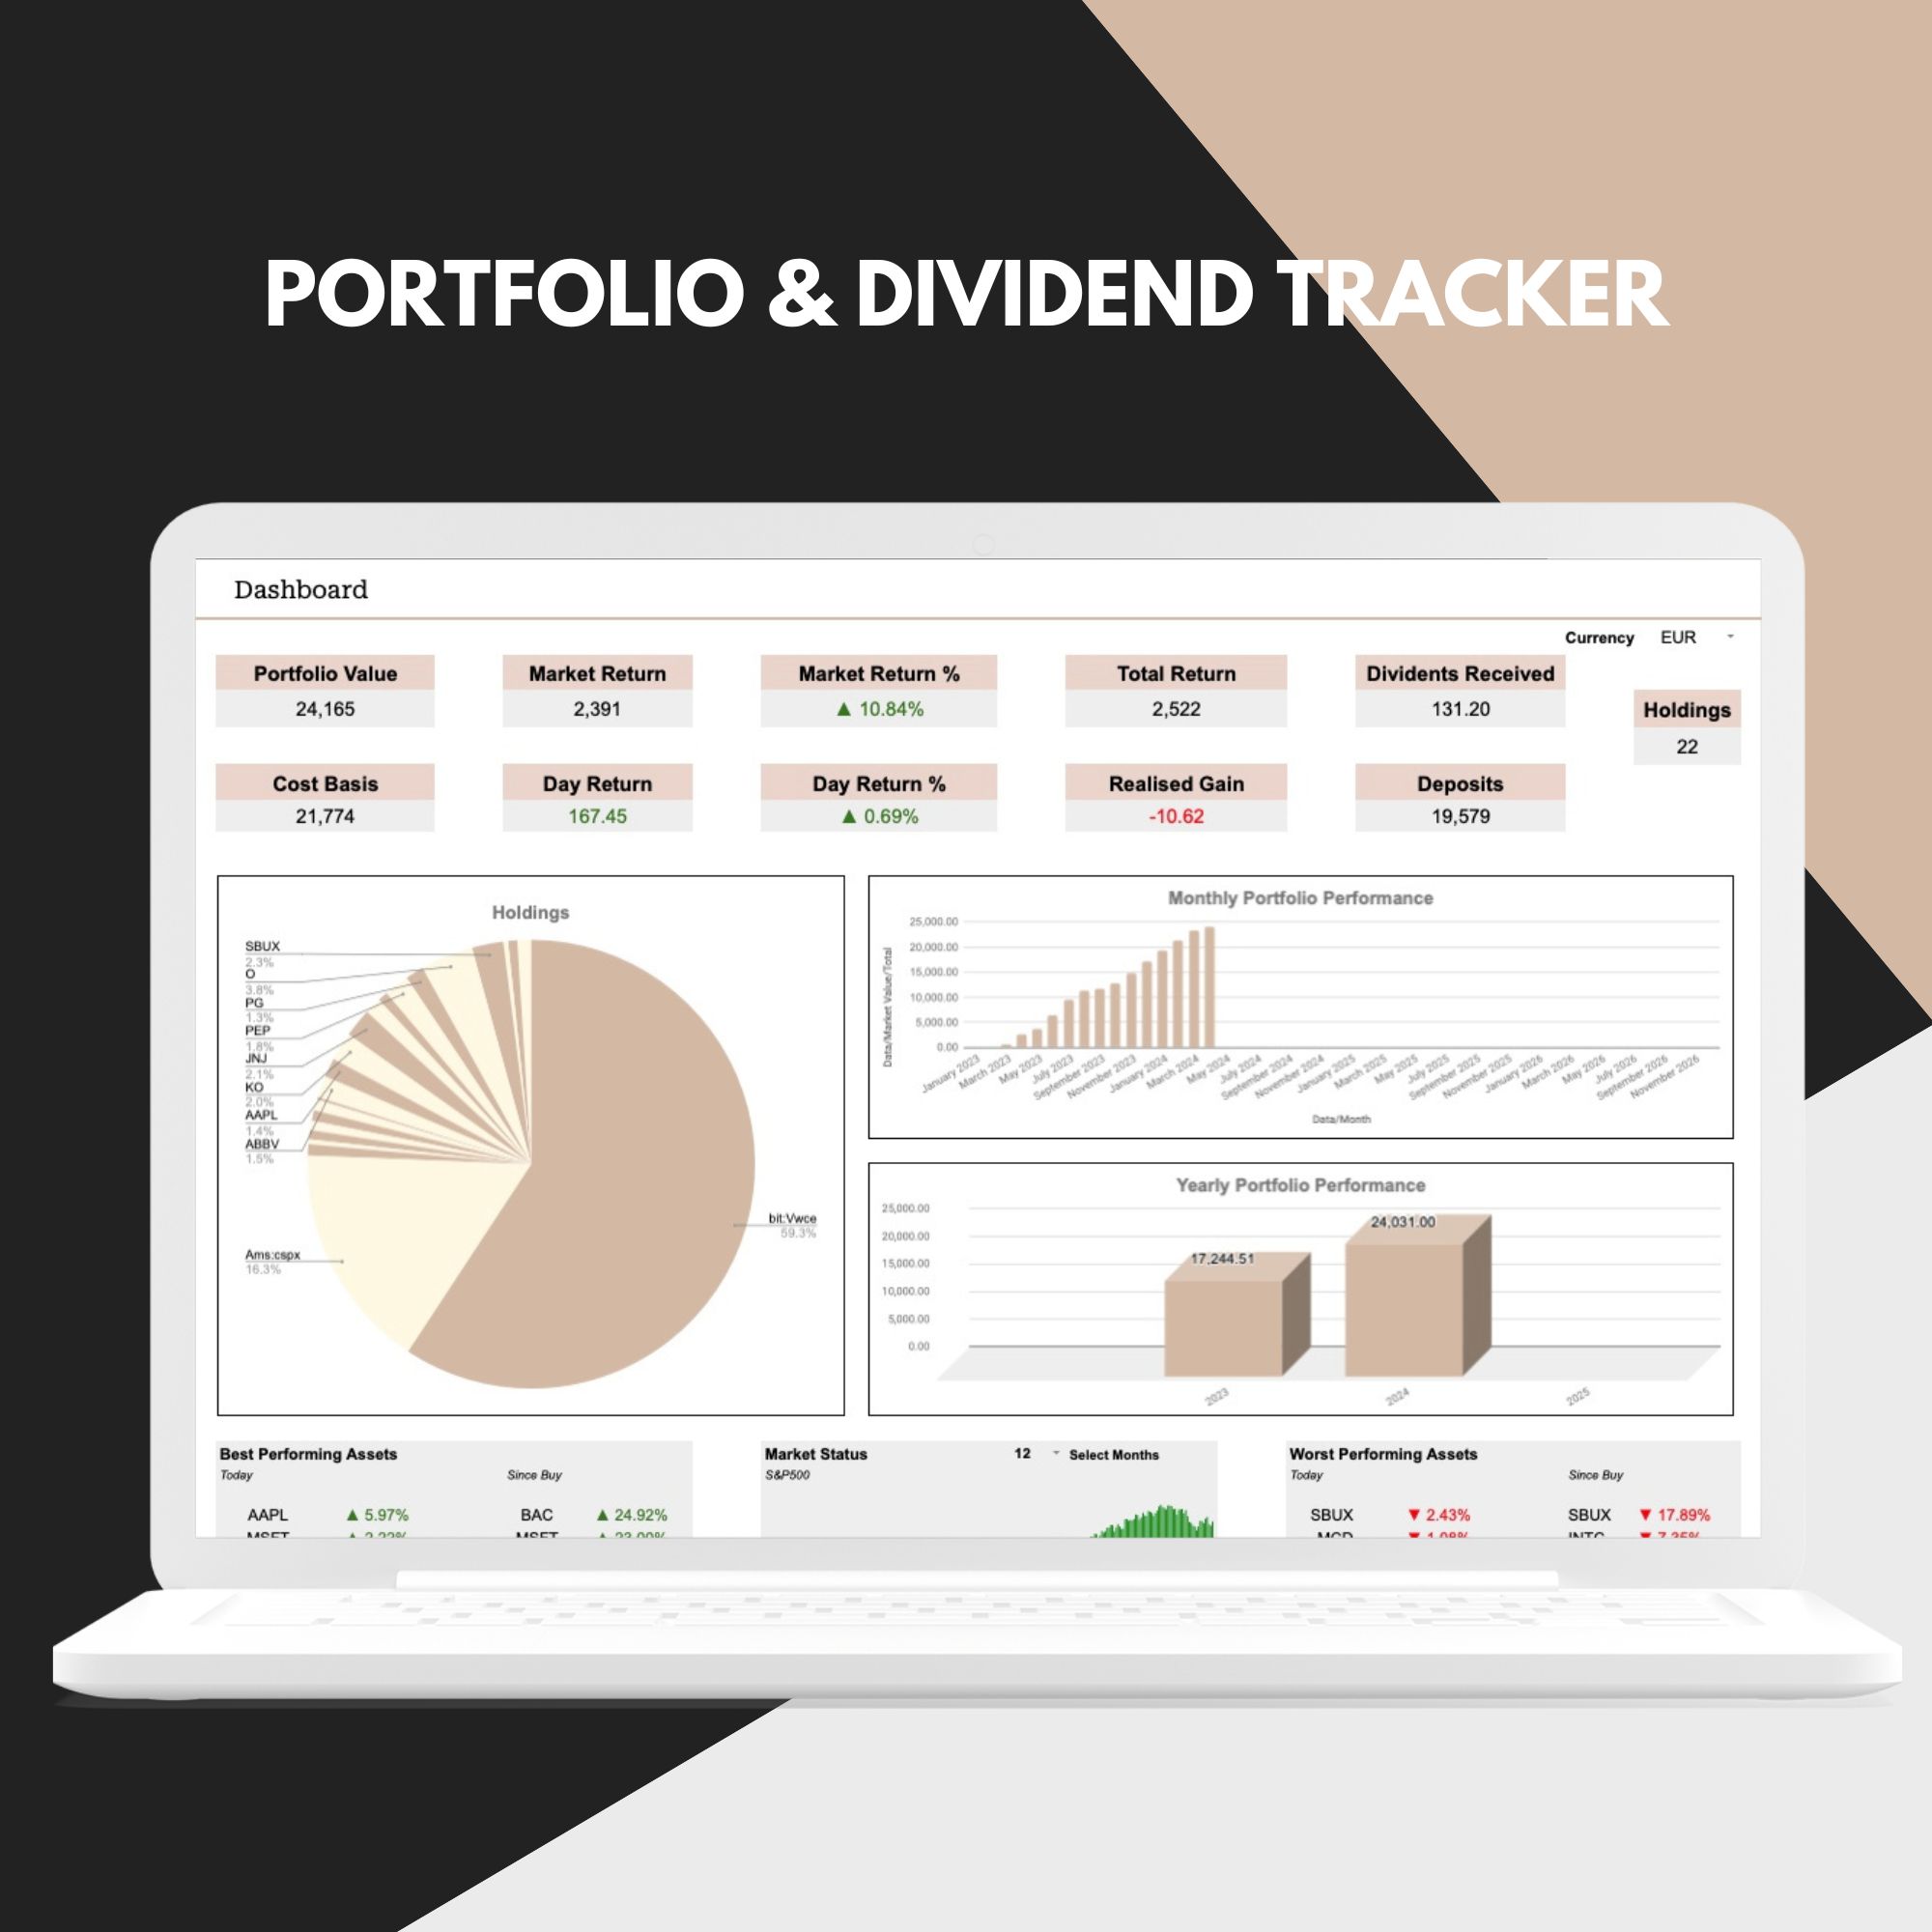
I maintain one of those as well. The method is in how to track your portfolio and dividends in Google Sheets, and the ready-made file is the Portfolio & Dividend Tracker, which I also sell.
The choice comes down to how you want to spend the time. With a spreadsheet you enter the transactions yourself and the file is yours to shape. With FolioLens the broker sync or the CSV import does the entry, and the charts are already built. Both get you to the same place, which is knowing what you own and what it has returned.
FAQ
Is FolioLens free?
No. FolioLens has a 14-day trial with every feature and no card required. If you do not pick a plan, the portfolio stays visible in read-only mode.
Does FolioLens work with UCITS ETFs listed on Xetra?
Yes. The demo portfolio in this article holds three Xetra-listed products priced in euro, including Vanguard FTSE All-World UCITS ETF (VWCE). FolioLens covers US, EU and UK markets.
Can FolioLens trade or move money in my broker account?
No. A broker connection is read-only, and the sign-in is handled by SnapTrade, so FolioLens never sees your broker password. If you would rather not connect anything, the CSV import and manual entry need no connection.
Which brokers does FolioLens support?
FolioLens connects automatically to 39 brokers and has CSV import guides for 24 more formats, plus a generic option for any other CSV file. Trading 212, Interactive Brokers and DEGIRO are on both lists.
Can I use a FolioLens report for my tax return?
Not as a tax document. The two PDF reports summarise holdings, returns and dividends received, which may help you gather figures, but they are not prepared to any country's tax rules. Tax treatment depends on your country of residence, so confirm your own position locally.
Nobody here is a licensed or certified financial adviser, and nothing in this article is investment advice. It is informational and educational only. Investments can fall as well as rise — do your own research, and speak to a qualified professional who knows your circumstances before acting on anything you read here.